UK Gender and Ethnicity Pay Gap Report 2026
Our commitments to fair work and inclusion
We are a Real Living Wage employer. We are committed to fair work and to building a diverse and inclusive workforce that reflects the communities we serve.
2026 marks:
- Our 11th year of reporting the UK gender pay gap (GPG)
- Our third year of voluntarily reporting the UK ethnicity pay gap
This page outlines our pay gap figures using UK Government methodology. Previous reports, (including the most recent Ireland gender pay gap report), and further details on how pay gaps are defined and calculated for our UK and Ireland businesses are available at sse.com/sustainability.
Our UK workforce
We employ around 14,000 people across technical, operational, and professional roles. The range of roles and workforce demographics influences our pay gap outcomes.
Our key business areas include:
More information about our organisation is available at sse.com/about-us.
2026 UK gender pay gap2
In 2025/26, our gender pay gap remained broadly stable, with small increases this year.
Key factors influencing changes:
- Reduced external hiring: Recruitment fell from 3,315 to 2,953, limiting opportunities to increase diversity, including at senior levels, which has previously supported progress in reducing the gender pay gap
- More internal hiring: Increased internal mobility (31% to 43%) linked to efficiency-related organisational restructuring
- Changes in Leadership representation3: Slight drop in women in leadership (27.7% to 27.3%) influenced by the organisational restructures.
More information on the efficiency-related organisational restructures referenced here can be found in SSE’s 2026 Annual Report and Sustainability Report.
Long-term progress
While pay gaps can fluctuate from year to year, the long-term trend remains positive.
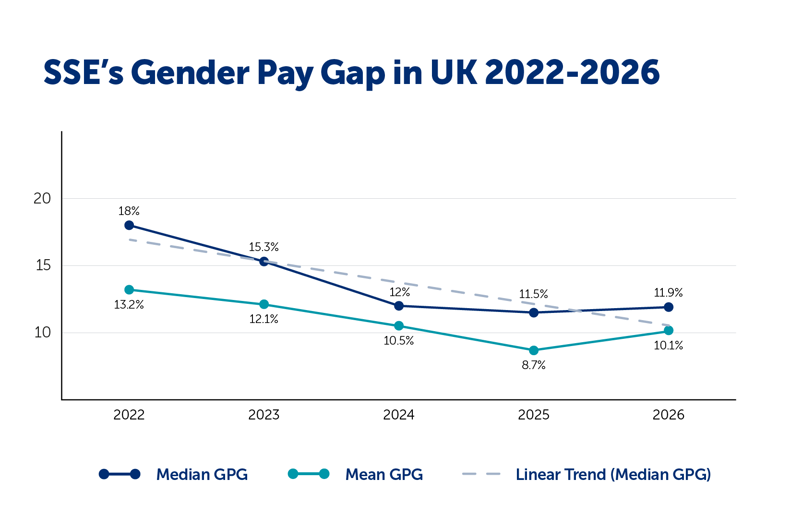
Since 2021/22, we have made significant progress in reducing our gender pay gap, from 18% to 11.9% in 2025/26.
This positive long-term trend reflects ongoing action to improve gender balance, especially in senior roles. We remain focused on increasing representation and supporting progression for women. This commitment sits alongside our wider approach to workforce planning, skills development, STEM initiatives, and internal mobility and is supported by our Inclusion & Diversity Strategy, designed to deliver sustained change over time.
Bonus gaps are influenced by:
- Fewer women in senior roles (where bonuses are higher)
- Inclusion of Spotlight recognition scheme awards (lower-value recognition payments), for which a higher proportion of women received. These awards are counted as a bonus, in line with government guidance, which reduces the average bonus received by women
Excluding Spotlight awards:
- Median gap reduces to 15.4%
- Median gap reduces to 37.1%
Looking ahead
We’ve made good progress in reducing pay gaps over time. Structural factors continue to influence the pay gap, including:
- Lower female representation in senior roles
- Differences in roles with additional pay
We will focus on sustained, long-term actions:
- Increasing women’s representation in senior and critical roles
- Supporting progression and retention
- Embedding inclusive policies and flexible working
- Strengthening an inclusive workplace culture
You can read more here: sse.com/gender-and-ethnicity-action-plan.
2026 UK ethnicity pay gap
In 2025/26, our UK ethnicity pay gap remained broadly stable with small year-on-year movements.
The median ethnicity pay gap remained negative, moving slightly towards parity from 2.2% to 1.8%, while the mean ethnicity pay gap increased from 3.9% to 4.2%.
Key insights
- The ethnicity pay gap remained broadly stable with small differences
- Ethnic minority representation is evenly spread across pay quartiles
- Senior-level representation increased in the SSE Group Executive Committee and the Direct Reports cohort from 2.4% the previous year to 3.6% (UK only)
- Overall workforce ethnic minority representation increased slightly from 11.2% to 11.4%
With continued disclosure, we are able to track how representation evolves as initiatives to support ethnic diversity across our organisation take effect.
UK ethnicity bonus pay gap
Bonus outcomes vary annually based on company, business and individual performance. As with the gender bonus gaps, differences reflect the proportion of employees eligible to participate.
Looking ahead
As with other workforce measures, we view year‑on‑year movements in the ethnicity pay gap in the context of workforce composition at the snapshot date.
We will continue long-term actions to:
- Improve ethnic diversity across all levels
- Strengthen leadership pipelines
- Embed culturally inclusive policies and processes
- Create an environment where all colleagues feel they belong and can progress
Our approach is underpinned by our ethnicity action plan, workforce ambitions and employee voice, available at sse.com/gender-and-ethnicity-action-plan.
[1] Data includes those employed by SSE in the UK on 5 April 2026. This totals 13,657 employees, 13,100 of which are included as relevant employees in the gender pay gap calculation (as defined by UK Government pay gap methodology). Pay gap data used throughout this report represent SSE’s UK operations as a whole, rather than individual legal entities and exclude Enerveo Ltd, which will be reported separately later in the year. A breakdown of gender pay gap data for all eligible legal entities under the UK Government’s gender pay gap reporting requirements can be found at gender-pay-gap.service.gov.uk. Data for previous years was calculated using the methodology in place at that time.
[2] Gender information is captured from legal documentation at employee onboarding and recorded in SSE’s HR data system, which maintains a 100% completion rate. In instances where employees transitioned after joining, the gender field on the HR data system is changed upon receipt of a formal employee request. For 2026, pay gap calculations were based on the 5 April snapshot date and the government methodology in place at that time.
[3] Recruitment and Leadership Group data covers all of SSE’s operations, the majority of which are in the UK. Leadership Group refers to employees in SSE’s senior-level pay grades.