


A clear pathway to lower bills
Delivering homegrown energy and electrifying energy use will cut bills and boost UK competitiveness.
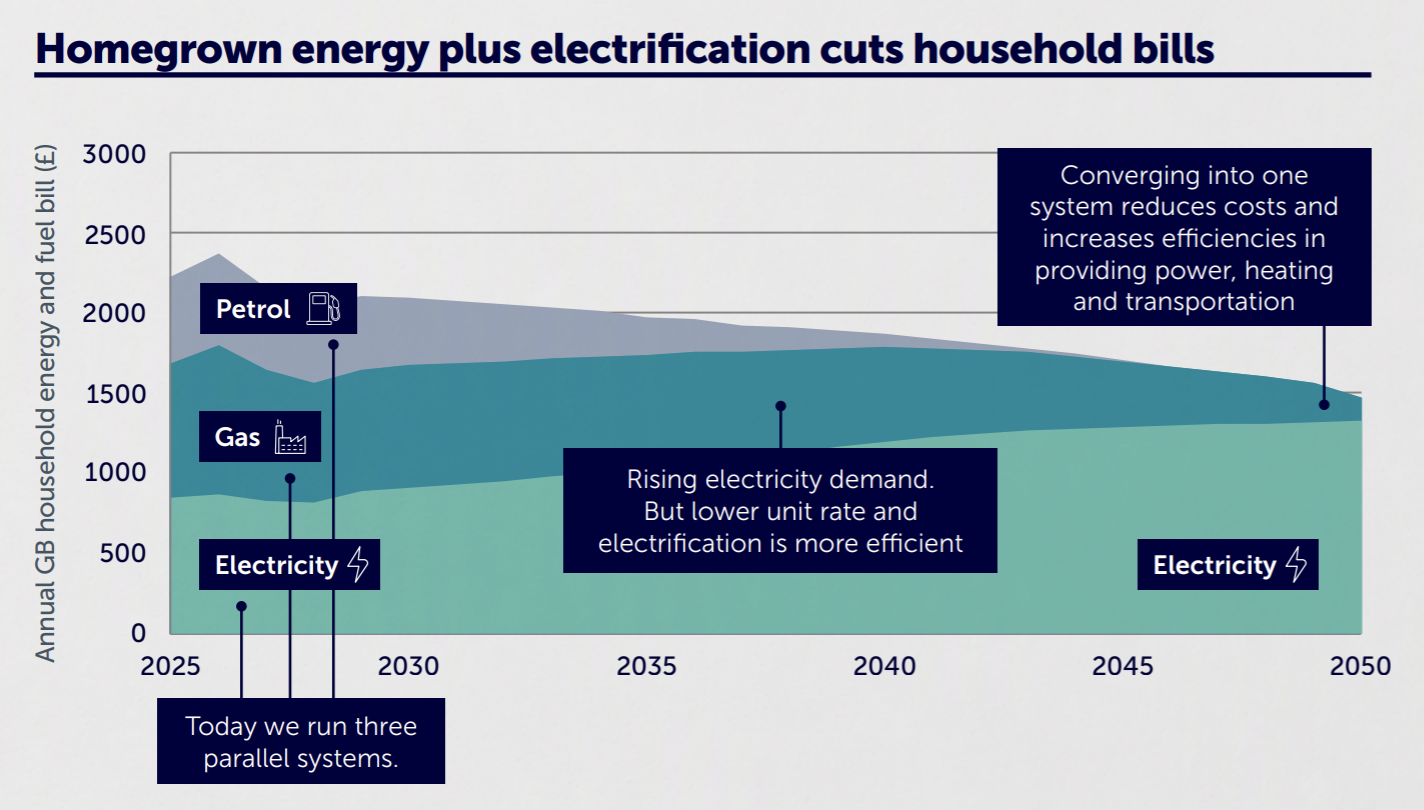
Electrification could cut bills by 35% while a shift to more UK-generated clean electricity at the same time will boost UK energy security and protect against price spikes.
Energy bills in the UK are heavily influenced by global gas markets. When international prices rise, households and businesses feel the impact. Our affordability analysis explores how increasing the use of UK-generated electricity, supporting greater electrification, and investing in the networks that connect it can help create a more stable, secure and affordable energy system over time.
Read the report to explore the evidence, key findings and practical steps that can help reduce exposure to global price volatility.

“The single biggest lever the UK has to lower energy costs over time is to make more use of the electricity generated here in the UK.
Right now, too many households and businesses remain exposed to global gas prices that are outside our control. By supporting electrification and investing in the networks needed to connect homes, businesses and industry to electricity, we can build a more secure, more competitive and more affordable energy system for the future."
Martin Pibworth
Chief Executive, SSE plc
The evidence overwhelmingly demonstrated that after a period of higher energy prices driven by fossil fuels, the UK is on the right path to achieving lower and more stable energy bills for the long term through investment.
We need to:
- Deliver clean power at pace
- Set out a comprehensive Electrification Strategy
- Ensure the transition is fair and equitable
What really makes up an energy bill?
Electricity and gas bills don’t just cover the cost of energy itself. They also pay for the networks that deliver it, supplier overheads and government schemes that support renewables and vulnerable households.

Electrification lowers bills overall
Your energy bill covers more than just the cost of gas and electricity. It also helps pay for the networks that deliver energy to homes and businesses, customer services provided by energy suppliers, and programmes that support vulnerable customers and other public policy schemes.
The UK is moving away from a more variable system where prices are driven by global events to one where more costs are fixed and driven by investments in homegrown infrastructure. This gives the country greater control over energy costs and means energy bills will become more stable.

What does electrification look like for consumers?
Most people should see benefits from using more electricity over time, but the savings will vary depending on their circumstances.
For example, households that switch to an electric vehicle could reduce their energy costs by around 30%. Those who also install a heat pump could save up to 5% more.
While many people will have the opportunity to make these changes as vehicles and heating systems are replaced, not everyone can switch straight away. Some households and businesses may need financial support to help with the upfront costs and any disruption involved in making the change.
2050 lifetime system cost estimates by technology

The UK will need more electricity in the future as transport, heating and industry increasingly rely on it.
There are different ways to meet that demand, but renewable electricity is now one of the lowest-cost sources of new power. Unlike fossil fuels, it does not rely on fuel bought from global markets, helping to provide greater certainty over future costs.
Producing more electricity in the UK can help reduce exposure to global price shocks, strengthen energy security and support lower energy costs over time.